Run Trace & Observability

See Every Run.
Down to the Block.

Every RenderDraw workflow run is a complete, replayable timeline of its blocks. Watch each step resolve live, inspect the typed data that flowed in and out, see how long every block took, and read exactly who approved or rejected at each human gate. Step through a debug run before you ship, resume durable runs exactly where they stopped, and keep a timestamped audit trail of every input, output, and decision.

See It In Action

The Run Trace Panel

Open any run and you get the full picture: the workflow graph on the left and a step-by-step trace on the right. Trigger a debug run and watch each block move through pending, running, and succeeded in real time — no manual refresh, no guesswork about where a run is.

platform.renderdraw.com/workflows/runs
RenderDraw workflow run trace: a workflow graph on the left with a Debug Run panel on the right listing each step (AI Prompt: Floor Plan Takeoff, CAD Extract Elements, Merge Takeoff and Pricing Context) with pending/running status.

The run trace panel — step-through debugging with live per-block status.

The Trace

What a Run Trace Shows You

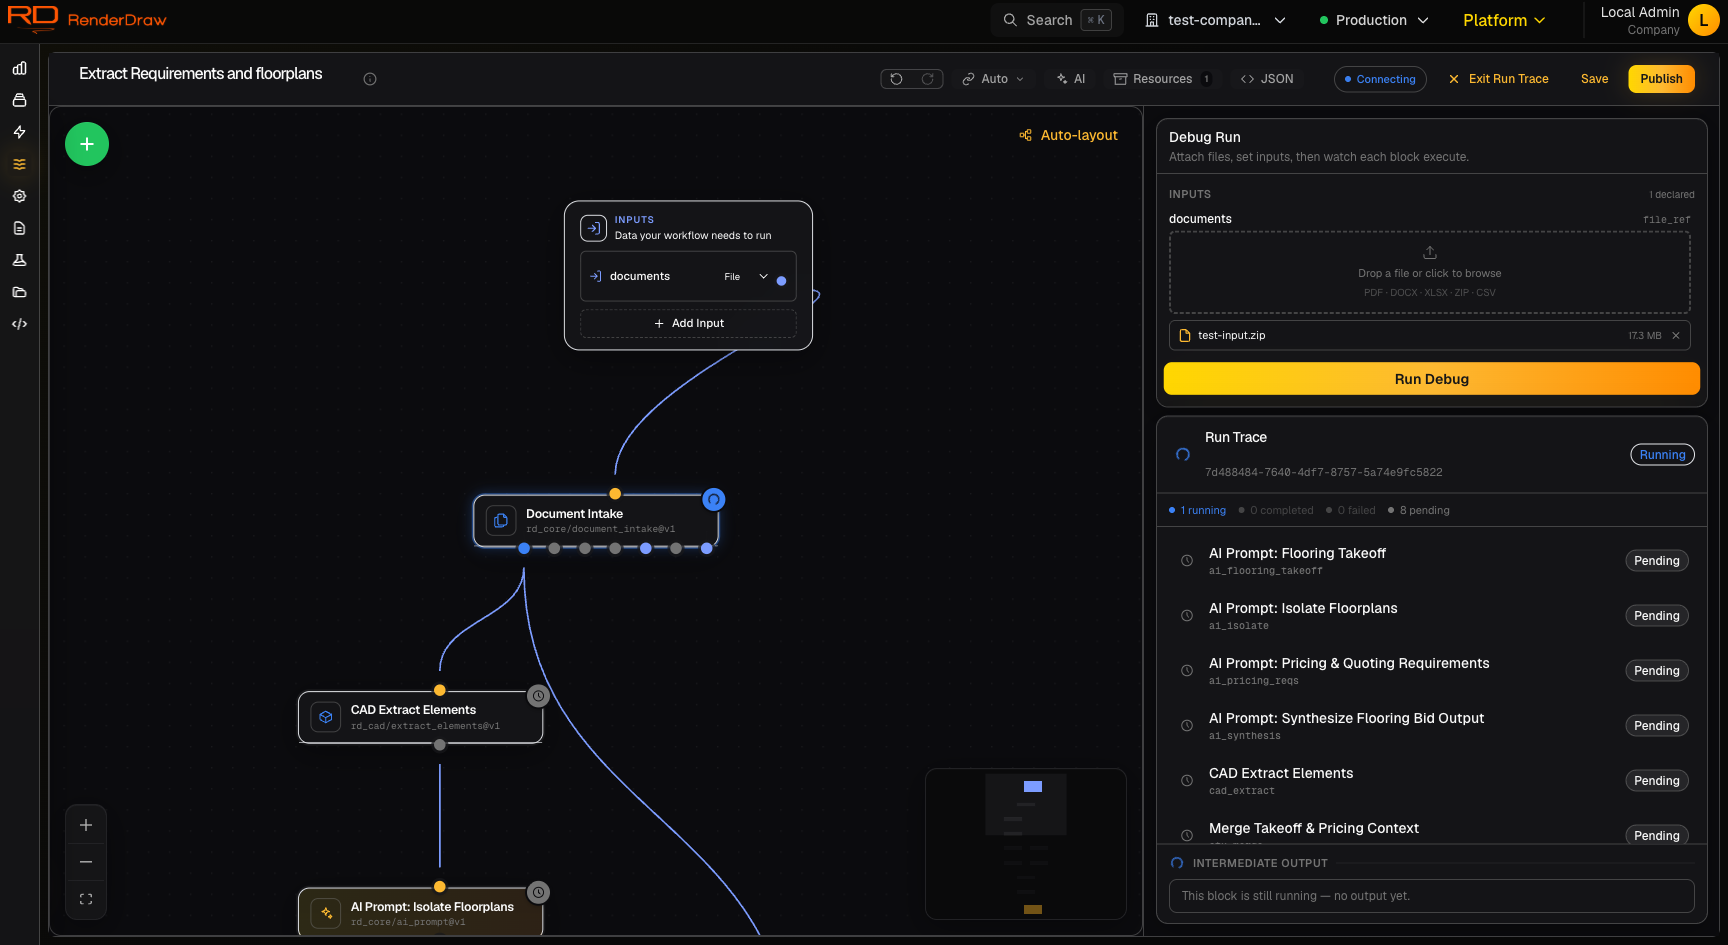
A run is never a black box. Every block in the timeline carries its own status, the typed data it received, the data it produced, how long it took, and — for human gates — the decision a person recorded.

🔗

Block Timeline

Every run is a timeline of its blocks in execution order. Each step reports its status — pending, running, succeeded, failed, or skipped — so you can see at a glance exactly which block a run is on and how it got there.

📥

Typed Inputs & Outputs

Open any block in the trace to inspect the typed inputs it received and the outputs it produced. Because every connection is typed JSON, you can follow how data was shaped from one block to the next across the whole run.

Duration & Retries

Each block records how long it took to run. Per-block retry policies are visible in the trace, and a block's fault port can route to a fallback branch — so a single failure reroutes instead of taking down the whole graph.

👤

Gate Decisions

Human gate decisions are part of the trace, not a side note. See who approved or rejected, exactly when, and what they changed — every reviewed correction is captured alongside the block it belongs to.

📡

Live Status Updates

As a run progresses, status updates stream into the UI in real time. Blocks flip from pending to running to succeeded in front of you — no polling, no manual refresh to find out what happened.

🔐

Tenant Isolation

Run history is scoped per team. Multi-tenant isolation means each team only ever sees its own runs and the data inside them — observability never leaks across organizations.

Step-Through Debugging

Debug Before You Ship

You don't have to push a workflow into production to find out whether it works. Trigger a debug run from the builder and watch each block resolve live in the trace panel — the same "Debug Run" control shown in the screenshot above.

Step through block by block as the run advances. Watch the inputs each block receives, confirm the outputs it produces, and catch a mis-wired port or a bad transform before it ever reaches a real RFP, takeoff, or customer.

  • Trigger a debug run and watch blocks move through pending and running status live
  • Inspect the typed inputs and outputs of every block as it resolves
  • Confirm fault paths and fallback branches behave the way you intended
  • Validate human gates and routing without sending anything out of the system
🤖

AI Prompt: Floor Plan Takeoff

Succeeded · 4.2s

Done
📐

CAD Extract Elements

Running · live status

Running
🔁

Merge Takeoff & Pricing Context

Pending · waiting on inputs

Pending
👤

Estimator Review Gate

Pending · human decision

Gate
Durable Execution

Durable by Design

Long-running workflows can't afford to lose their place. RenderDraw persists run state after every block completes, so a run resumes exactly where it left off after a restart — even when it has been paused for days waiting on a human gate or a CAD conversion.

💡

State is persisted after every block. If the server restarts or infrastructure shifts mid-run, the workflow picks up at the next block — no lost work, no duplicated actions, and the full trace stays intact across the gap.

A run can wait on a gate or a conversion for days and still resume cleanly. The trace records the pause and the resume just like any other transition, so the timeline is continuous even when the calendar isn't.

Resume After Restart

Because state is checkpointed at every block, a restart never rewinds a run. Execution continues from the last completed block, and the trace shows an unbroken timeline from trigger to completion.

Survives Long Waits

Runs that sit waiting on a human gate or a long CAD conversion stay durable for as long as they need to — even across days — and resume the moment the gate is answered or the conversion completes.

Run History

Find Any Run, Open Any Trace

Every run is recorded and searchable. List all of your runs, narrow the view, and open any past run to read its full trace — the same block timeline, inputs, outputs, durations, and gate decisions you'd see on a live run.

List Every Run

See a complete history of workflow runs in one place. Each entry links straight to its full trace, so closing the loop on a past run is one click away.

Filter & Search

Filter the run list by status, by trigger source, and by workflow. Zero in on failed runs, runs started from a specific trigger, or every run of a given workflow.

Open Any Past Trace

Open any historical run to step back through exactly what happened — what data each block received, what it returned, how long it took, and which human decided what.

100%
Audit trail coverage
Real-time
Live run updates
0
Lost runs after restart
Per-team
Tenant-isolated history
📋

A full audit trail, retained for closeout and dispute defense. Every block input and output and every human gate decision is timestamped and retained, so months later you can show precisely what the workflow did, what data it used, and who signed off.

Stop Guessing What Your Workflows Did

Open the run trace, step through a debug run, and watch every block resolve in real time — with a timestamped record of every input, output, and decision behind it.

Explore the Engine